Facts, Myths and Talking Points Heading into the 2022 Stanley Cup Playoffs
May 1, 2022
-30104725.png)
Stats based on last 10 Stanley Cup champions

YES: Over the past 10 seasons, a team who has won the season series vs. an opponent has a 65-46 series record when facing that same opponent in the ensuing Stanley Cup Playoffs.
BUT: This is far more relevant early in the playoffs when facing teams within your own Division and Conference. Over the same 10 seasons under the same criteria, the team that won the regular season series has a losing series record of 6-12 when meeting that same team in the Conference Finals or Stanley Cup Final.
NOT REALLY: Over the previous 10 postseasons (excluding 2020 because of neutral site games), nearly half of all best-of-seven series were won by the lower seed (66 of 135; 48.9%). In the 2021 Stanley Cup Playoffs, a whopping 10 of 15 series were won by the team who started the series on the road.
PLUS: Among the last 10 Stanley Cup champions, six had to win at least two series as the lower seed on their path to hoisting the Cup: 2012 Kings (x4), 2014 Kings (x3), 2015 Blackhawks (x3), 2018 Capitals (x2), 2019 Blues (x3) and 2021 Lightning (x2).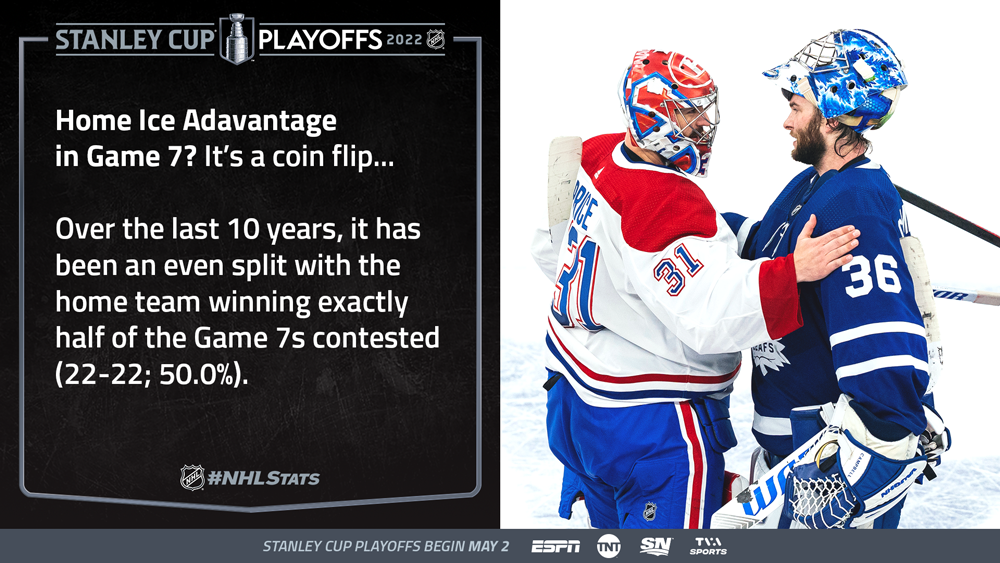

GENERALLY, YES: Seven of the last 10 Stanley Cup champions had a points percentage of .600 or better in their final 10 regular-season games leading into their championship run, including four who checked in with a .750 PTS% or higher along the final 10 games.
BUT: The Lightning have bucked that trend in recent years. The 2021 Lightning lost each of their last three games heading into the postseason, including the last two against Florida by a combined 9-1 margin, before eliminating those same Panthers in six games in the opening round en route to back-to-back Stanley Cups.
The 2020 Lightning, who had the worst points percentage in their final 10 regular-season games among the last 10 champions – a season which was paused because of the pandemic – rebounded months later to record the second-best win percentage among that group during their postseason run to the Stanley Cup (18-7; .720 W%).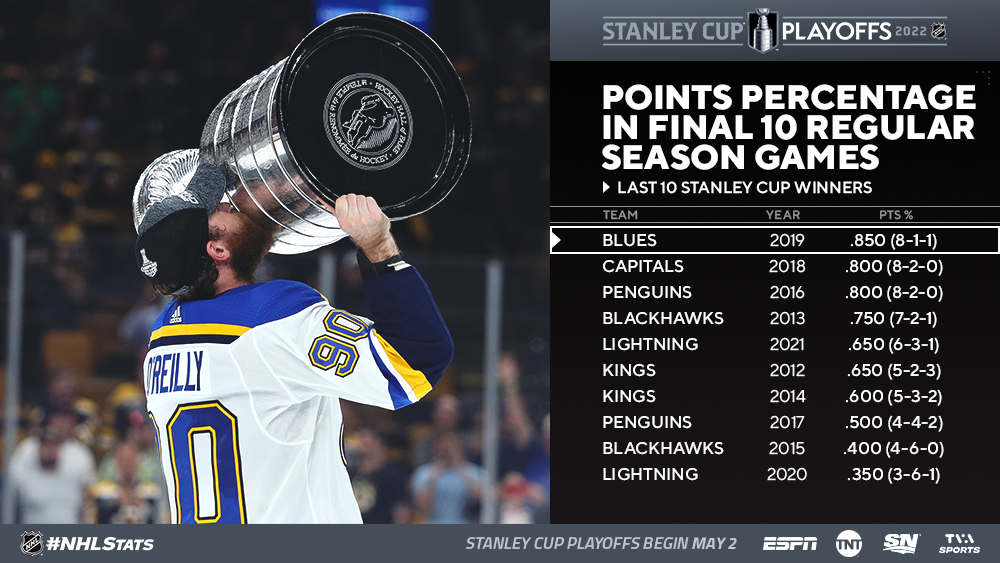
2021-22 CONTEXT: The teams with the best record over their last 10 games in the Eastern Conference include the Hurricanes (8-2-0, 16 points), who enter the postseason on a six-game winning streak, the Maple Leafs (7-2-1, 15 points), Panthers (7-3-0, 14 points) and Lightning (7-3-0, 14 points). In the Western Conference, the teams with the best record in their last 10 entering the postseason include the Wild (8-1-1, 17 points), Blues (7-2-1, 15 points) and Oilers (7-2-1, 15 points).
* Two series feature a matchup between teams that each finished 2021-22 on a hot stretch: Toronto, Tampa Bay, Minnesota and St. Louis all won at least seven of their final 10 games. The last time this happened in the opening round – two series with both teams winning seven or more of their last 10 contests – was in the 2011 Conference Quarterfinals. That year, the Lightning entered the playoffs on a 7-3-0 run and defeated the Penguins (8-2-0), while the Predators had a 7-2-1 stretch to close the regular season before eliminating the Ducks (7-3-0).
NO: Six of the last 10 Stanley Cup champions had one goaltender start every game of their postseason run, including each of the last three. Additionally, Jonathan Quick in 2012, Corey Crawford in 2013 and Andrei Vasilevskiy in 2020 and 2021 were never pulled after a start and played every minute in goal.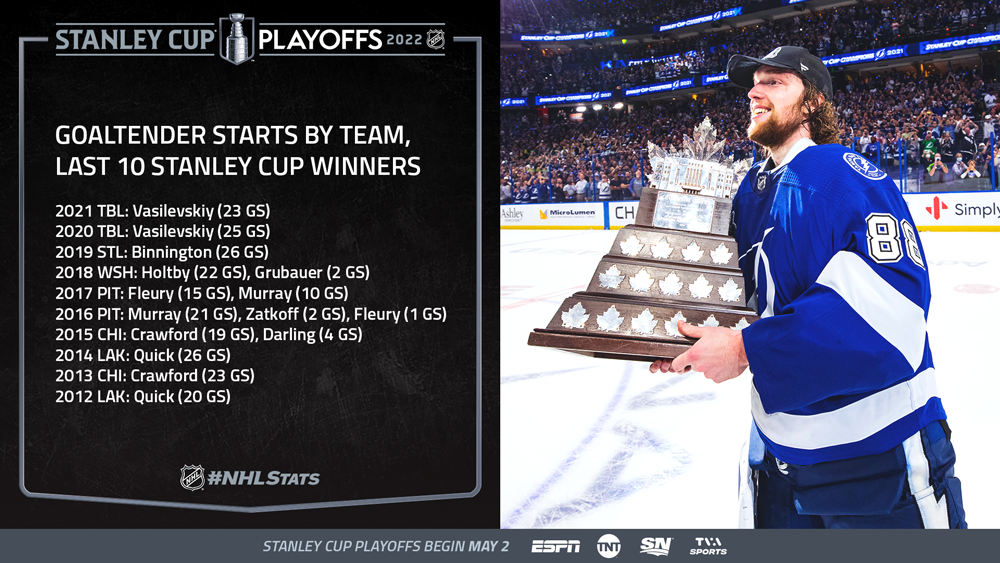
BUT: For a four-year period from 2015 to 2018, the Stanley Cup winner had multiple goaltenders make two or more starts during the postseason run, including three instances where the goaltender who started Game 1 of the opening round was different than the goaltender who earned the Cup-clinching victory:

HITTING: Since 2011-12, the NHL has had an average of 45% more hitting in the playoffs per 60 minutes than in the regular season (64.8 in the playoffs vs. 44.9 in regular season), including an increase of 60% or higher in each of the last two (66% increase in 2020-21 and 60% increase in 2019-20).
PENALTIES: Since 2011-12, eight of the last 10 seasons have had equal or more power plays per 60 minutes in the playoffs than in the regular season (6.2 in playoffs vs. 6.1 in regular season). In total, the NHL has seen an average of 6% more penalties per game in the playoffs compared to the regular season.
YES: Recently, at least. Each of the last five Stanley Cup champions had a top-10 power play in the regular season, with four of those five ranking among the top five of the sixteen playoff teams in the ensuing postseason run.
BUT: For a five-year period from 2012 to 2016, the Stanley Cup champion ranked no higher than 16th on the power play in the regular season and, despite winning the Stanley Cup, none of the five ranked higher than sixth among all playoff teams during their postseason run.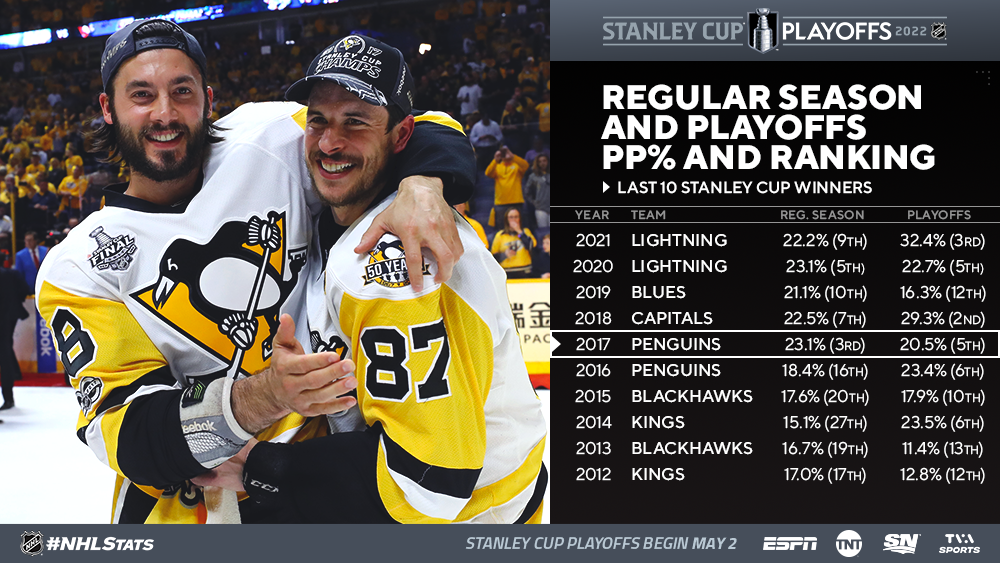

IMPORTANT: But it is all about peaking in the playoffs. Of the last 10 Stanley Cup champions, only six ranked among the top-10 in the League in PK% during the regular season, but, nine of 10 ranked among the top-10 in the ensuing playoffs, including five who had a top-five ranking or better during their postseason run.
ALSO: Six of the last 10 Stanley Cup winners posted a PK% in the playoffs that was stronger than their regular-season success rate. That total lifts to seven if you include teams that were within one percentage point of their regular-season total.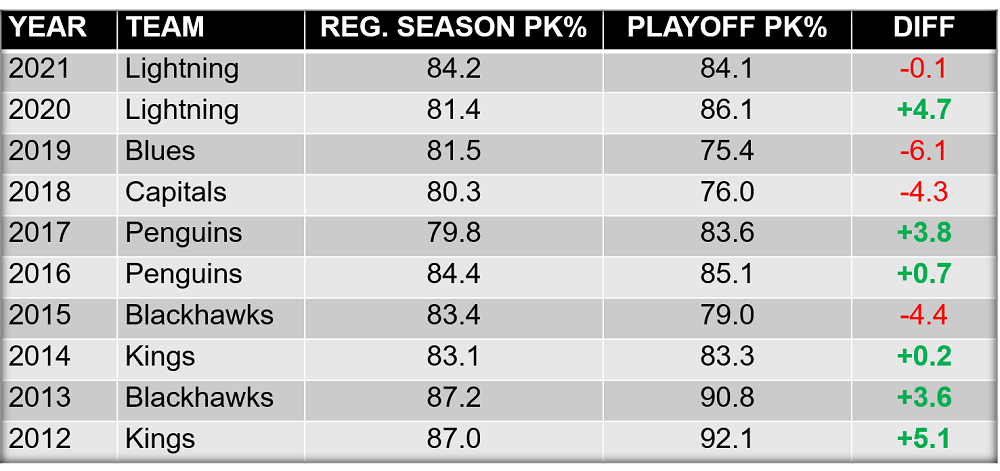

YES: Based on the last 10 Stanley Cup champions, teams needed more goal production from outside of their top three producers in the playoffs than they did in the regular season. In total, seven of the last 10 Stanley Cup champions have seen a decrease in percentage of team goal production from their top three point producers in the playoffs vs. the regular season.
BUT: Your top players still need to be your top players. Of the previous 10 Stanley Cup champions, only one team had two different players among their top three scorers during the playoffs compared to their top three during the regular season – the Blues in 2019. St. Louis’ top three point producers in the regular season were Ryan O’Reilly, Vladimir Tarasenko and Brayden Schenn while in the playoffs they were O’Reilly, Jaden Schwartz and Alex Pietrangelo.
YES: Over the last 10 years, five teams reached the Final after making a coaching change during the regular season, including in each of the last three seasons. Of those five, three went on to coach their team to a Stanley Cup championship.
BUT: Jon Cooper, who has the longest tenure of any active NHL head coach, is the two-time defending Stanley Cup champion.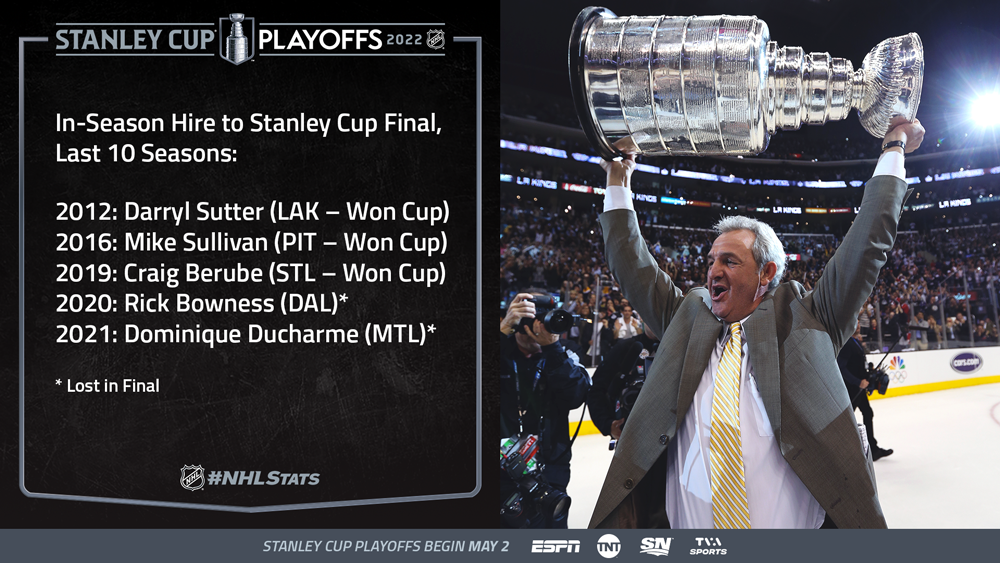

NO: Of the 15 players acquired by the eventual Stanley Cup champion on Trade Deadline Day over the past 10 years, 11 of them did not appear in a single postseason game for the team during the ensuing Cup run. Two of the past 10 champions (WSH in 2018 & LAK in 2012) did not make a single Deadline Day move.
BUT: Of the four players acquired on Trade Deadline Day over the past 10 seasons that appeared in at least one playoff game for the team during their Stanley Cup run, three played pivotal roles while appearing in 20+ games that postseason: Barclay Goodrow in 2020 (1-5—6 in 25 GP w/ TBL), Andrew Desjardins in 2015 (1-3—4 in 21 GP w/ CHI) and Marian Gaborik in 2014 (14-8—22 in 26 GP w/ LAK). The other: Mark Streit in 2017 (0-2—2 in 3 GP w/ PIT).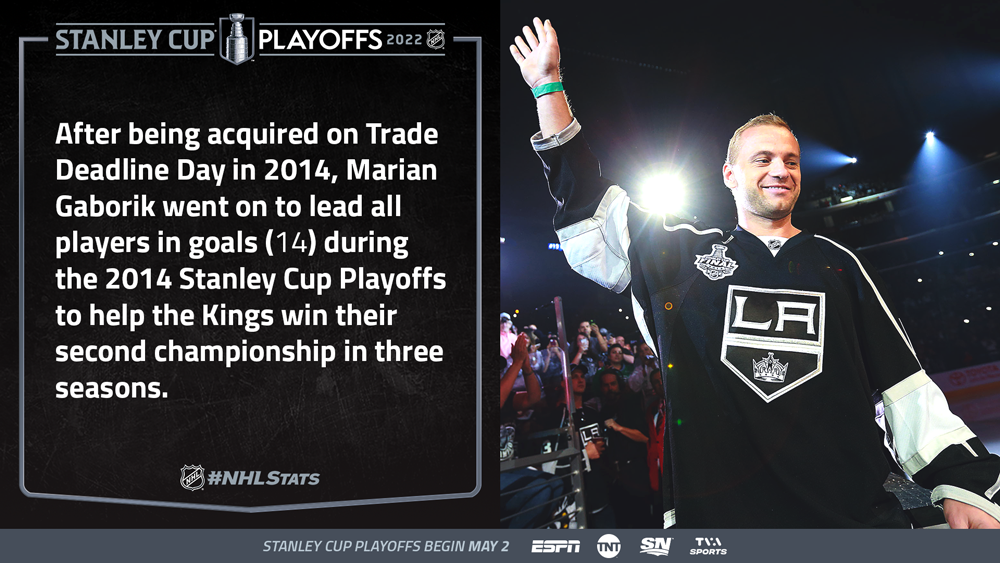
COURTESY NHLmedia.com

Hello There. I found your blog using msn. This is a very well written article. I’ll make sure to bookmark it and come back to read more of your useful info. Thanks for the post. I will definitely return.